
Overview
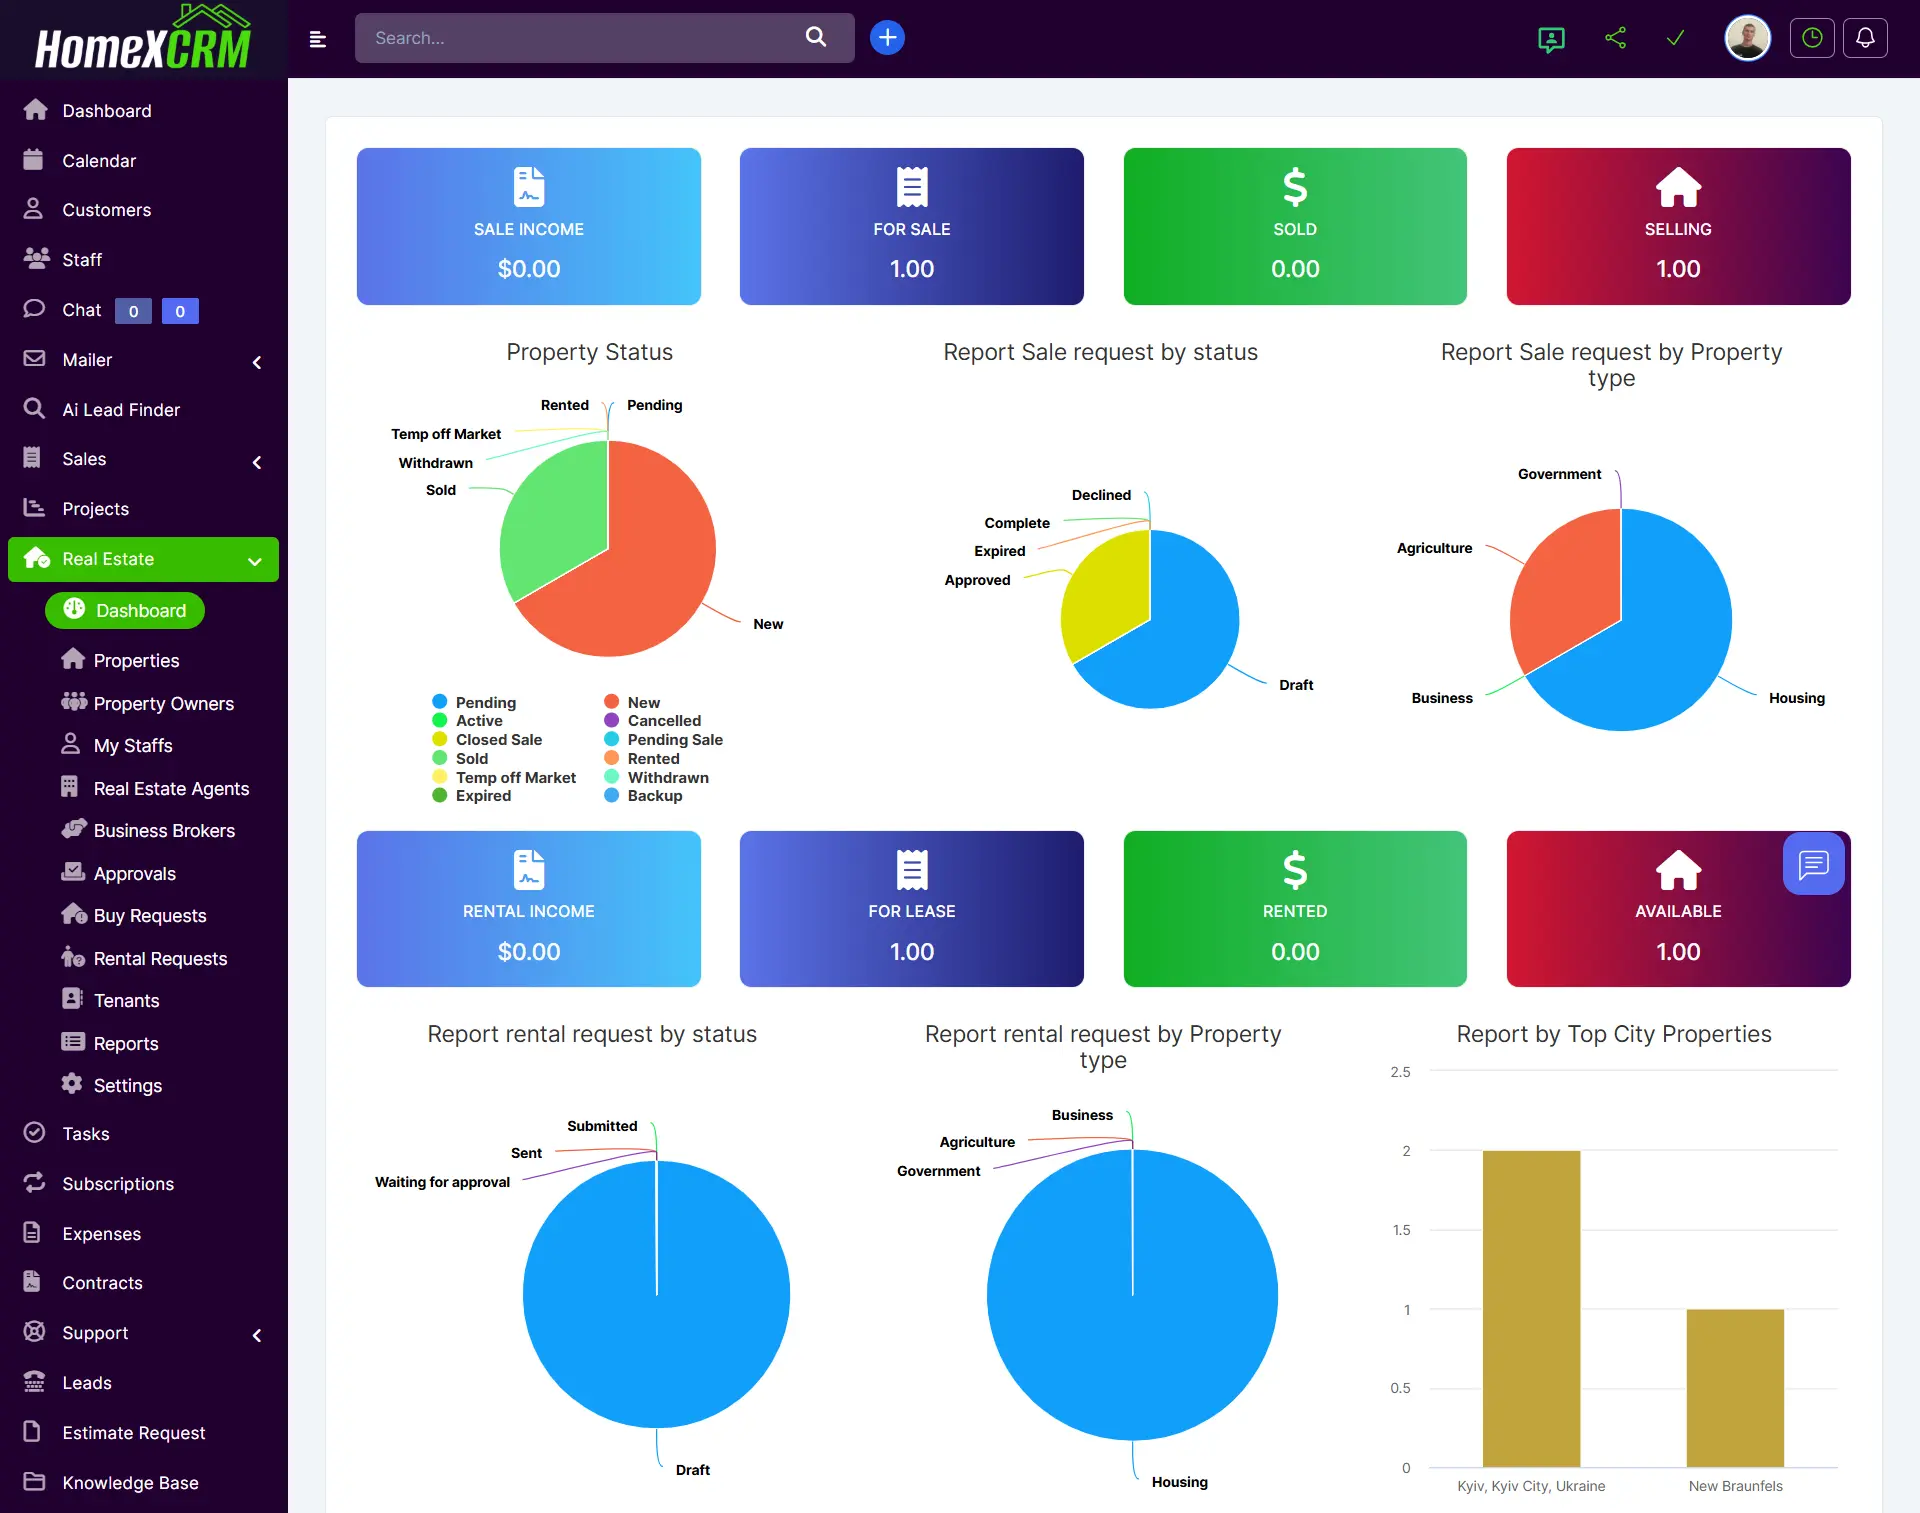
The Real Estate Dashboard is the main operational control panel of the Real Estate module in Homex CRM.
It provides real-time insights into:
- Sales performance
- Rental activity
- Property statuses
- Request analytics
- Market distribution by type and location
The dashboard combines financial indicators, status tracking, and visual reports in one unified workspace.
💰 Sales Performance Section
Located at the top of the dashboard, this section shows key sales indicators:
🧾 Sale Income
Displays total revenue generated from closed property sales.
🏠 For Sale
Number of properties currently listed for sale.
💵 Sold
Properties successfully sold and completed.
🔄 Selling
Properties currently in negotiation or active sale process.
This block helps management instantly evaluate current sales activity and pipeline volume.
🏘 Rental Performance Section
The rental indicators are displayed in the lower section of the dashboard.
🧾 Rental Income
Total revenue generated from rental contracts.
🏢 For Lease
Properties available for rent.
💰 Rented
Properties with active lease agreements.
🟢 Available
Units ready for rental but not yet contracted.
This section allows tracking occupancy rate and rental performance.
📊 Property Status Report
The Property Status Pie Chart visualizes distribution of properties by status.
Statuses include:
- Pending
- New
- Active
- Cancelled
- Closed Sale
- Pending Sale
- Sold
- Rented
- Temp Off Market
- Withdrawn
- Expired
- Backup
This helps quickly identify:
- How many listings are active
- Which properties are stalled
- Where deals are stuck in the pipeline
📑 Sales Request Analytics
Report Sale Request by Status
Displays the distribution of buy requests by stage:
- Draft
- Approved
- Complete
- Expired
- Declined
This allows management to measure conversion efficiency from request to approved deal.
Report Sale Request by Property Type
Breakdown of sales requests by property category, such as:
- Housing
- Agriculture
- Government
- Business
This helps identify which segments generate the most demand.
🏢 Rental Request Analytics
Report Rental Request by Status
Shows rental requests categorized by:
- Draft
- Submitted
- Sent
- Waiting for approval
Helps track rental pipeline progression.
Report Rental Request by Property Type
Displays rental demand by property type (e.g., Housing, Business, Agriculture, Government).
This helps understand tenant market behavior.
🌍 Report by Top City Properties
This chart shows property distribution by city.
It helps answer:
- Which cities generate most activity
- Where inventory is concentrated
- Where expansion opportunities exist
🎯 What the Dashboard Enables
The Real Estate Dashboard allows you to:
- Monitor total revenue in real time
- Track property lifecycle stages
- Analyze demand by property type
- Identify top-performing markets
- Evaluate sales and rental pipelines
- Make strategic business decisions faster
👤 Role-Based Visibility
Dashboard visibility depends on user role:
Admin
Full financial, property, and analytics overview.
Manager
Team-level performance and request tracking.
Agent
Assigned properties and personal performance metrics.
Staff
Limited operational overview.
🚀 Best Practices
- Update property statuses immediately after any change.
- Monitor Draft vs Approved requests daily.
- Track Selling properties closely to reduce deal delays.
- Review Expired or Withdrawn listings weekly.
- Use city and property-type reports for market strategy planning.